
A field rep closes out a beat with fifteen retailer visits logged and twelve orders booked. On paper, that is an 80% strike rate, a good day. But by the time those orders reach the distributor’s
A field rep closes out a beat with fifteen retailer visits logged and twelve orders booked. On paper, that is an 80% strike rate, a good day. But by the time those orders reach the distributor’s system, three get rejected outright: one for a stock mismatch, one for a credit hold nobody flagged, one because the SKU was already delisted at that outlet. The rep’s numbers look fine. The order book does not.
Order rejection is one of the most under-tracked leaks in secondary sales, largely because it hides inside a metric that looks healthy from a distance. Most FMCG sales reviews report orders booked, not orders that actually made it through to fulfillment without being bounced back. That gap, between an order placed and an order accepted, is where a measurable share of secondary sales value quietly disappears every month.
This piece stays narrowly focused on that gap: what causes order rejection, how to measure it properly, and the concrete steps that bring the rate down. For the broader distribution framework this sits inside, see our guide to primary, secondary, and tertiary sales.
An order rejection is any order booked by a field rep or placed through a retailer channel that does not go on to be accepted and fulfilled as originally recorded. This is distinct from an order that is fulfilled late or fulfilled partially, both of which fall under fill rate and fulfillment tracking. Rejection happens earlier in the sequence, at or immediately after booking, before the order ever reaches the delivery stage.
Rejections generally fall into three buckets:
Each of these has a different root cause and a different fix, which is why lumping them into a single “rejected orders” number tends to hide more than it reveals.
Order Rejection Rate = (Number of Orders Rejected ÷ Total Orders Booked) × 100
Track this at three levels for it to be actionable: overall, by distributor, and by SKU. An overall rate of 6% can be masking one distributor running at 18% while the rest of the network sits comfortably under 3%. Without the distributor-level split, that distributor’s problem never surfaces until it shows up as a bigger issue, like delisting or a beat coverage drop.
Most rejection-reduction efforts fail because they treat all three categories as one problem and apply a single fix, usually “retrain the field team.” Retailer-side causes need commercial and scheme-design fixes. Distributor-side causes need better inventory visibility. Process causes need better tooling. Diagnosing which bucket is driving the rate is the first real step, not the training conversation.
A rejected order is not neutral, it is a cost. Each one represents a wasted store visit, a rep who now has to re-negotiate or re-route, and a distributor relationship absorbing friction it did not need. At scale, high rejection rates also distort demand forecasting: booked-but-rejected volume can quietly inflate what looks like healthy secondary sales activity while actual sell-through stays flat. For the broader mechanics of how that distortion plays out across dispatch and demand data, see our comparison of sell-in vs sell-through data.
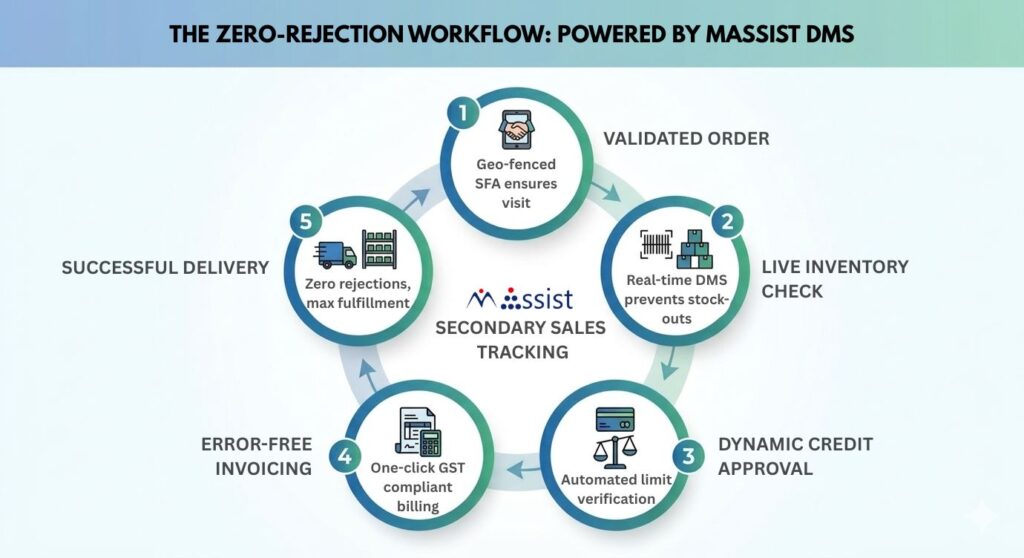
The single highest-leverage fix is closing the gap between what the app shows and what is actually sitting in the distributor’s godown. When a rep can see real-time stock at the point of order booking, stock-out-driven rejections drop sharply because the rep simply cannot book against inventory that does not exist.
Build credit-limit checks and active-scheme validation into the order flow itself, not as a post-booking reconciliation step. If a retailer is over their credit limit or a scheme has expired, the app should flag it before the order is logged, not after the distributor rejects it.
Every rejected order should be tagged with a reason at the moment it’s rejected, not reconstructed later from memory or a call to the distributor. Without structured reason codes, rejection rate is just a number with no diagnostic value.
Aggregate rejection data by beat and by area manager so patterns become visible early, a specific route consistently hitting MOQ shortfalls, or one distributor’s godown chronically running stock-outs on fast-moving SKUs. This is the same real-time-visibility principle behind broader secondary sales tracking; see how SFA improves secondary sales visibility for the underlying data-capture mechanism this depends on.
| KPI | What It Tells You |
|---|---|
| Rejection rate by distributor | Where fulfillment-side problems concentrate |
| Rejection rate by SKU | Which products have chronic stock or listing issues |
| Rejection rate by reason code | Whether the problem is commercial, stock, or process |
| Rejection rate trend (month over month) | Whether fixes are actually working |
No. A rejection happens at or near booking, before fulfillment. A return happens after the product has already reached the retailer, typically due to quality, expiry, or overstock issues.
Most well-run FMCG distribution networks operate under 5%. Rates consistently above 10% at the distributor or SKU level usually point to a structural issue, stock visibility, credit process, or scheme design, worth investigating immediately.
Not entirely, retailer-side decisions like shelf space or last-minute cancellations will always account for some baseline. The realistic goal is eliminating the preventable share: stock-out, credit, and process-driven rejections that better data visibility can catch before the order is even booked.
Book a personalized MAssist DMS demo
Order rejection rate rarely gets its own line on a sales dashboard, it tends to get buried inside broader secondary sales or fulfillment numbers. But it’s one of the few metrics that points directly at preventable, fixable friction in the order-to-cash chain. Track it at the distributor and SKU level, tag every rejection with a reason, and close the stock-visibility gap at the point of booking, and the rate moves faster than most teams expect.
Get notified about the next update






 Salesforce Automation
 CRM & Lead Management